

12 Teams Aligned.
One Shared Source of Truth.
The initiative was scoped around speed. Research revealed the problem was structural.
Financial Crime
Regulatory Compliance
Data Visualization
Desktop
Responsive

FINRA's DXT initiative was stalling. Every team was using different tools.
Seven incident types. Six national cause teams. Twenty-five thousand matters a year. Every team tracking the same cases in different systems with no shared language for status, priority, or ownership.
The investigators weren't the problem. The organizational structure was. Nobody had named that yet when the engagement started.

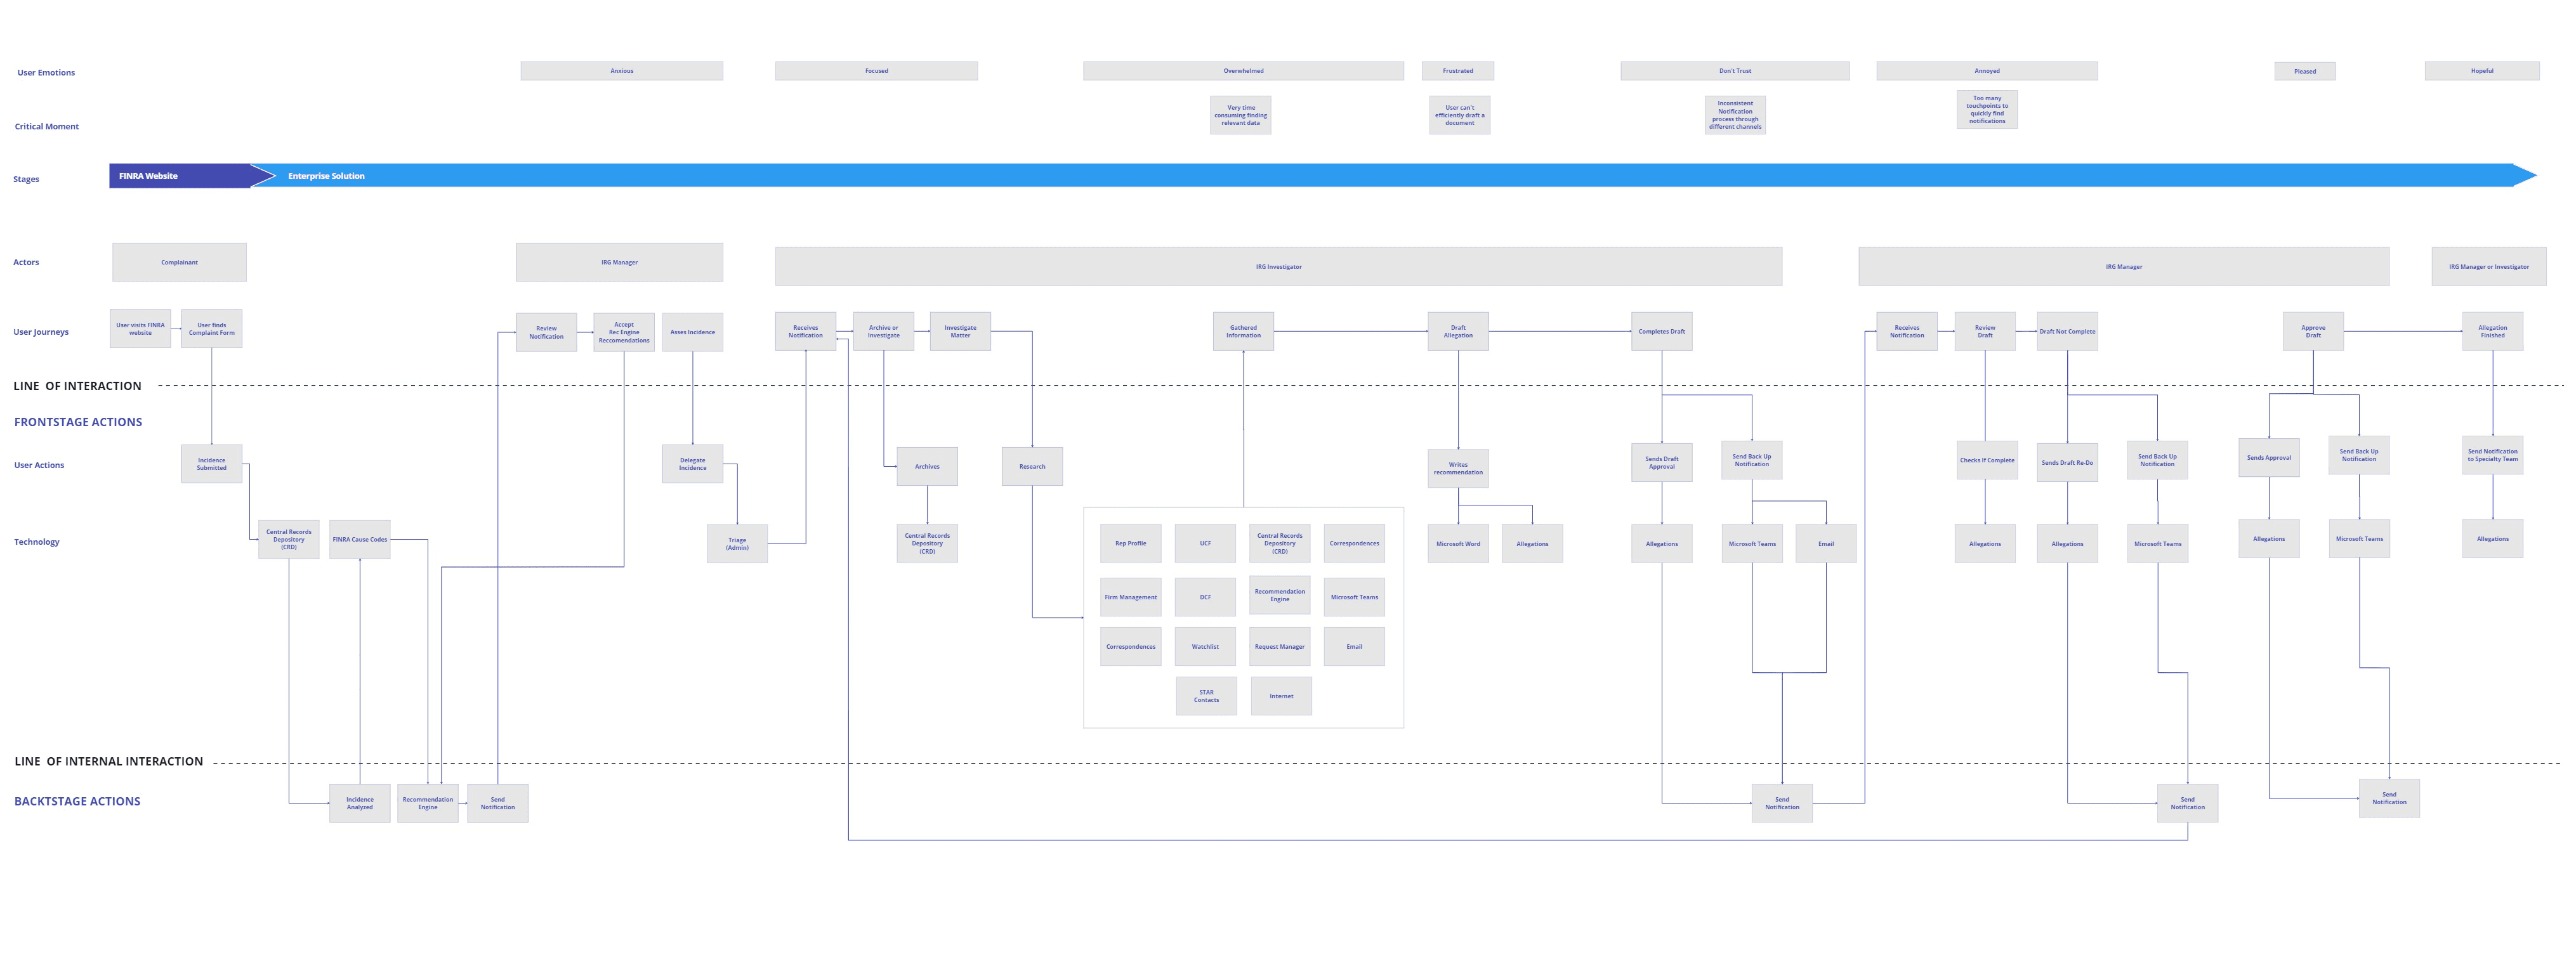
Matter sequence map. Seven incident types across six national cause teams. Built before any screen was designed.
WHAT I DID
Ran 10+ investigator interviews across twelve teams. Built a matter sequence map and service blueprint before any UI work began. Neither was scoped. Both became the foundation the design was built on.
When research reframed the brief mid-engagement, the product manager and engineering lead needed to come along. Presenting the findings as a business risk did that. Continuing on the original direction would have shipped faster and solved less.
Facilitated the cross-team prioritization session in Miro. Designed and ran FINRA's first-ever self-guided prototype validation session. Twelve teams had never given direct feedback on a prototype before. The lo-fi format was intentional. Pink indicators marked what worked so investigators could explore without a facilitator in the room.

Cross-team prioritization session. Twelve investigation teams in one Miro board.

Tools in one location scored 90%. That number ended the debate.
No one had mapped the full investigation flow before. Building without it would have meant optimizing one team's workflow at the expense of another's.
Lo-fi prototype. Pink indicators marked what features were functional. Investigators explored without a facilitator. First time this had ever been done at FINRA.

Matter cards. Priority linked to a named investigator. Accountability built into the data model, not a separate report.
OUTCOMES
6 Tools Consolidated
One configurable workspace replaced all six. No more copying data between systems to build a single case.
Widget Architecture Adopted
The design patterns built for this dashboard became the standard across the full DXT platform.

Modular workspace. Investigators configure their own view. Organization-level governance controls what surfaces where.

Manager view. Active cases and team assignment share one surface, so a lead balances workload without chasing twelve teams for status.

Investigator view. Status and owner sit on every row, so triage happens without opening a single record.
What I'd do differently
Start widget governance conversations with engineering before the architecture is set. Cross-widget data sharing and state persistence weren't defined until mid-build. When the component model is this central to the product, build the technical model and the design model together from day one, not in sequence.