

THE PROBLEM

FIRST MOBILE APP
MY ROLE
Led the UX effort to translate complex hardware behavior into a clear, actionable diagnostic experience.
WHAT I OWNED
End-to-end UX across a .NET-backed React Native diagnostic app — field research, fault-state taxonomy, component architecture, and implementation-ready specs for iOS, Android, and the .NET backend team.
HOW I WORKED
Every screen designed mobile-first — thumb reach zones, glove-friendly targets, high-contrast states for outdoor lighting. I aligned with engineering on React Native's single codebase before any component work began, then stayed in through integration to catch inconsistencies and refine interactions against real engineering test sessions. Design intent matched shipped behavior because I was in the room when it didn't.
THE CORE TENSION
Complex hardware signals needed to be translated into clear, actionable diagnostic steps — in real-time, in the field, under pressure.
RESEARCH & DISCOVERY

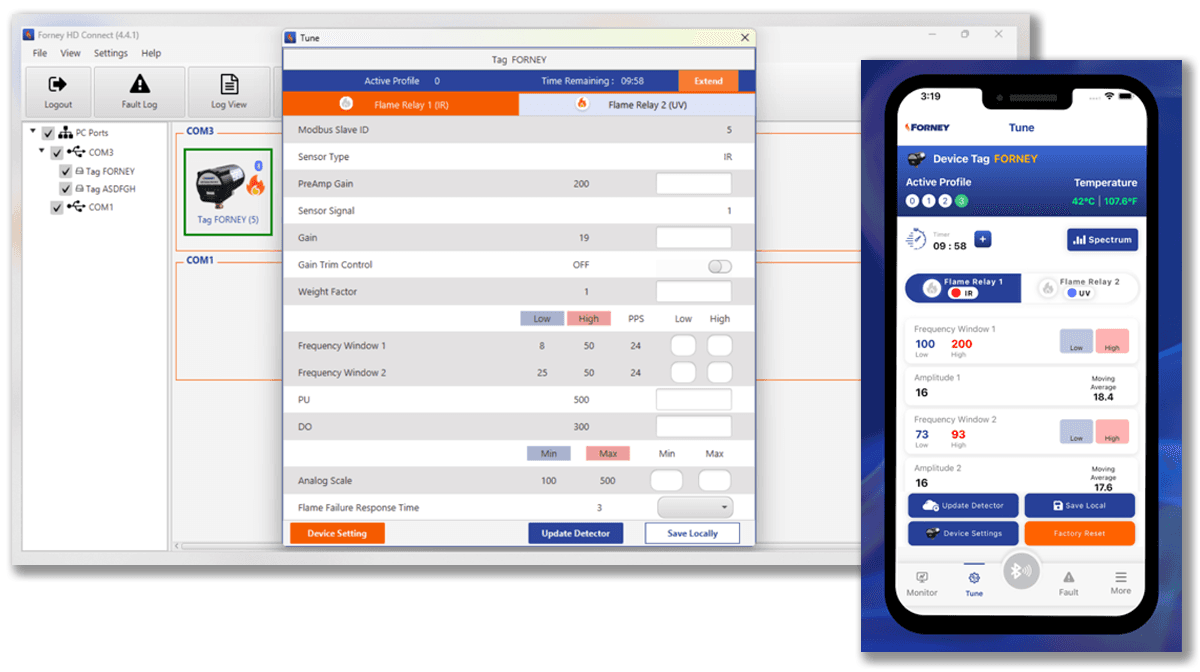
Existing Desktop Tool — Forney HD Connect, the software technicians were working around
STAKEHOLDER INQUIRY
What field technicians actually told us.
KEY FINDING
The hardware signal needed to drive the diagnostic experience — not the other way around.
CORE TENSION
Field simplicity vs hardware complexity — two needs the design couldn't trade off against each other.
FIELD TECHNICIANS WANTED
Simple guided steps on a phone
Works in bad conditions
Fast fault identification
ENGINEERING NEEDED
Real sensor signal data
Cross-platform .NET architecture
DESIGN RESOLVED
Fault-state taxonomy as UX logic
Mobile-first, desktop-ready
DESIGN DECISIONS
Every decision traced back to a finding.
DECISION 1
Hardware-aware guided flow — the app identifies the device before it gives any guidance.

FINDING
Every flame sensor model had different fault states and signal ranges. Generic guidance wasn't just unhelpful — it sent technicians down the wrong diagnostic path.
INSIGHT
The diagnostic flow couldn't start until the app knew exactly which device it was talking to. I brought this to product and engineering as a foundational architecture requirement before any screens were designed.
DESIGN
Device identification built into the first interaction — hardware type, fault states, signal thresholds, and diagnostic steps loaded automatically. Nothing generic, nothing that could apply to the wrong sensor.
DECISION 2
Fault-state taxonomy as UX logic — turning engineering signal data into guided steps.


FINDING
The iScan 3+ was generating complex fault signal data that technicians couldn't interpret without deep product knowledge. The signal existed. The translation didn't.
INSIGHT
The fault-state taxonomy wasn't an engineering reference — it was the content architecture for the entire diagnostic experience. I mapped every fault state to plain-language guidance before any screens were designed.
DESIGN
Every fault state surfaces as a plain-language action, not a raw error code. The technician gets exactly what to do next — not a number to look up.
DECISION 3
.NET MAUI — mobile-first architecture designed to scale to desktop.
FINDING
Field technicians needed a phone-based experience. Engineering needed an architecture that could grow into desktop workflows as the product expanded.
INSIGHT
The platform choice wasn't a technical decision — it was a product strategy decision. React Native on a .NET backend was the only choice that could be mobile-first today and desktop-ready tomorrow without a rebuild.
DESIGN
React Native front end on a .NET backend — mobile-first, cross-platform, architected for future desktop expansion. Every component built with the full device spectrum in mind, not just the current phone use case.
DECISION 4
Designed for the full device spectrum — not just the most common sensor.

FINDING
Technicians worked across a wide range of flame sensor models and installation types. An app designed around the most common scenario would fail everyone working with anything else.
INSIGHT
Edge cases in industrial diagnostics aren't edge cases — they're the actual job. I brought this framing to product before the IA was finalized.
DESIGN
Every sensor type, fault state, and signal range accounted for in the guidance system from day one. Spec assumptions validated against actual iScan 3+ hardware behavior before build completed.
DECISION 5
Prototype validated against real hardware — sensor signal as the source of truth.

FINDING
Field conditions — poor lighting, confined spaces, time pressure — meant a prototype that looked right on a desk could completely fail in a real diagnostic situation.
INSIGHT
Validation against the actual hardware signal was the only test that mattered. I pushed for prototype testing against the iScan 3+ itself before any build began.
DESIGN
Every guided repair flow tested against live hardware signal — how and where the signal was actually used, not where it was assumed to be. The sensor was the source of truth throughout.
PROCESS
Five phases — from hardware audit to live prototype validation. Research drove architecture. Architecture drove every screen.
1
Field Workflow & Hardware Audit
Observed technicians diagnosing in the field — mapping friction points, failure moments, and the manual workarounds the app had to replace.
2
Fault-State Modeling & Signal Mapping
Collaborated with firmware engineers to translate raw sensor data into a shared fault taxonomy — every UI state mapped to a real hardware condition.
3
Diagnostic Flow Architecture
Designed structured troubleshooting paths that surfaced root causes and real-time sensor feedback at every decision point — no ambiguity in the field.
4
UI Design & Interaction Patterns
Built for glanceability under industrial conditions — sensor health hierarchy, color-coded states, 8pt grid, component state matrices, and mobile breakpoint specs across the full device inventory.
5
Hardware-Integrated Prototype Validation
Ran task-based usability sessions with technicians using prototypes connected to real iScan® 3+ hardware signals — findings drove final iteration before build.
DESIGN SYSTEM
Brand and fault-state colors were kept separate from day one. Each had a different job.
Chentronics' primary brand color is orange — which directly conflicts with warning and alert states if used at full saturation. Tinted versions of the brand palette created enough separation so orange could still function as a brand signal without being read as a hardware fault. Alert states — green, magenta, blue, yellow, red — mapped to real hardware conditions and stayed visually distinct from brand at every usage level.

FIELD-CONDITIONS DESIGN CONSTRAINTS
Designed for how and where the app actually gets used

PROTOTYPE
From sensor signal to guided repair validated against real hardware, built to run on more than one surface.
Available now directly from Chentronics download at:
chentronics.com/solutions/iscan3.
Not yet on the Apple App Store or Google Play — coming soon.

OUTCOMES
A scalable diagnostic framework built for cross-platform growth and faster fault resolution in the field.
First mobile app for Chentronics
The iScan® 3+ diagnostic app is Chentronics' first mobile product a new channel for field support built from the ground up.
Reduced technician guesswork
Guided troubleshooting flows replaced manual cross-referencing with clear, step-by-step repair paths anchored to real hardware signal data.
Visibility into sensor health and modes
Technicians could immediately understand device state without consulting hardware manuals — fault state surfaced as plain-language action.
A cross-platform foundation established
The same .NET MAUI UI layer, the same backend — ready to serve a desktop surface when the roadmap calls for it, without a rebuild.
PROJECT GALLERY
From hardware signal research to shipped diagnostic app


